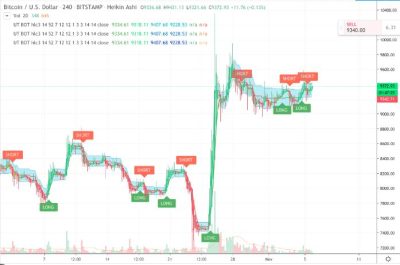
Professional traders often have meticulously crafted trading strategies that they keep confidential. Many of these strategies are developed using TradingView.com, a platform that offers comprehensive price charts for various currencies. Traders can create their strategies using a set of predefined rules or by coding in Pine Script, TradingView's proprietary scripting language.
To execute their strategies, traders must constantly monitor the charts. When their strategy signals an entry or exit point, they need to act quickly, opening or closing positions on their exchange accounts. This vigilance is required around the clock, making trading a time-intensive activity.

To streamline this process, Homoro has developed a tool that allows traders to link their Homoro account with their TradingView.com account. When a strategy triggers an entry or exit signal, TradingView.com sends a webhook notification to Homoro.io. This enables the signal to be executed automatically across all exchanges integrated with Homoro's API. Currently, the following exchanges are supported on the Homoro platform:
- Binance
- Bingx
- OKX
- ByBit
- Coinbase
- MEXC
- Toobit
This integration significantly reduces the manual effort required from traders, allowing them to focus more on strategy development and less on execution logistics.

Developing a strategy on TradingView involves a few key steps, primarily using Pine Script, TradingView's scripting language. Here’s a basic guide to get you started:
1. Define Your Strategy: Determine the rules and conditions for your strategy. For example, you might want to buy when a short-term moving average crosses above a long-term moving average and sell when it crosses below.
2. Open Pine Editor: On TradingView, open the Pine Editor from the bottom panel of the chart.
3. Write Your Script:
- Start by defining your strategy using the `strategy()` function.
- Use Pine Script functions to calculate indicators and conditions. For example, you can calculate moving averages with `ta.sma()`.
- Define your entry and exit conditions using `strategy.entry()` and `strategy.close()`.
Here’s a simple example of a moving average crossover strategy:
//@version=5
strategy("Simple MA Strategy", overlay=true)
fastMA = ta.sma(close, 14)
slowMA = ta.sma(close, 28)
if (ta.crossover(fastMA, slowMA))
strategy.entry("Buy", strategy.long)
if (ta.crossunder(fastMA, slowMA))
strategy.close("Buy")
plot(fastMA, "Fast MA", color=color.blue)
plot(slowMA, "Slow MA", color=color.red)
4. Backtest Your Strategy: Apply your script to the chart and use the Strategy Tester tab to see how it would have performed historically. This helps you understand the potential profitability and risks.
5. Optimize and Refine: Adjust your strategy parameters and conditions based on the backtesting results. You can add more conditions, filters, or different indicators to improve performance.
6. Deploy Your Strategy*: Once you’re satisfied with the backtesting results, you can use the strategy in real-time trading or paper trading to see how it performs in live market conditions.
